Langfuse July Update
Chart any table, dashboards via API, CLI, and MCP, new graph view modes, media previews and more
 Marc Klingen
Another exciting month in the books. In July, we made your trace data much easier to look at and worked on our upcoming product roadmap (more on each below):
- Any table is a chart: chart the observations table on the query you already filtered, and spot count, cost, and latency spikes in a strip above it.
- Dashboards via API, CLI, and MCP: create and manage them end-to-end, ask your agent to build a custom Langfuse dashboard.
- Graph view, aggregated and expanded: read an agent trace as a compact overview, or as the DAG it actually ran.
- Media previews in tables and JSON views: open images, audio, and files inline, broadening our support of multi-modal use cases.
Q3 roadmap and Langfuse Town Hall
Our public roadmap lays out what we're shipping in the coming months. To hear it from me directly: join us on Wednesday, August 12 at 9am PT / 6pm CEST. I'll demo what we shipped over the last three months and walk through the upcoming features.
Any table is a chart
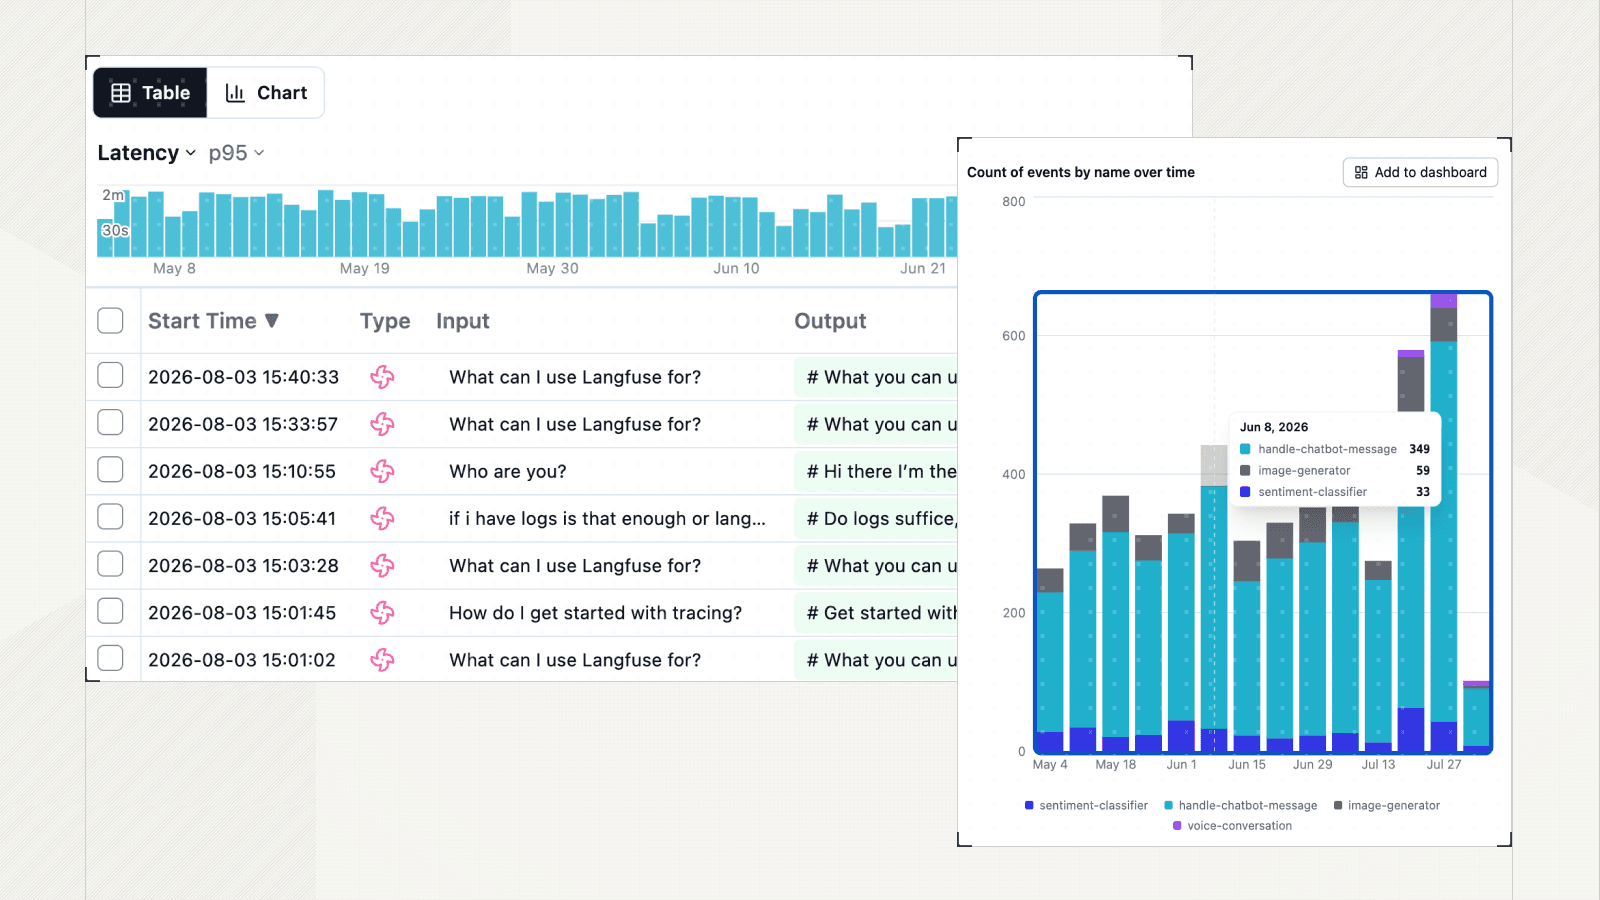
You already filter the observations table down to the exact rows you care about. Now you can see that same slice as a chart. A Table/Chart toggle turns the current view into a time series, and a Visualize panel picks the chart type, metric, aggregation, and breakdown. "p95 latency by model" is a few clicks over rows you already filtered.
Pulse sits directly above the table as a compact chart strip. Each bar is a time bucket showing observation count, total cost, or p95 latency. Click a tall bar and the table narrows to that window. Finding the spike and reading what caused it is now one motion instead of a sort across your whole table.
Manage dashboards via API, CLI, and MCP
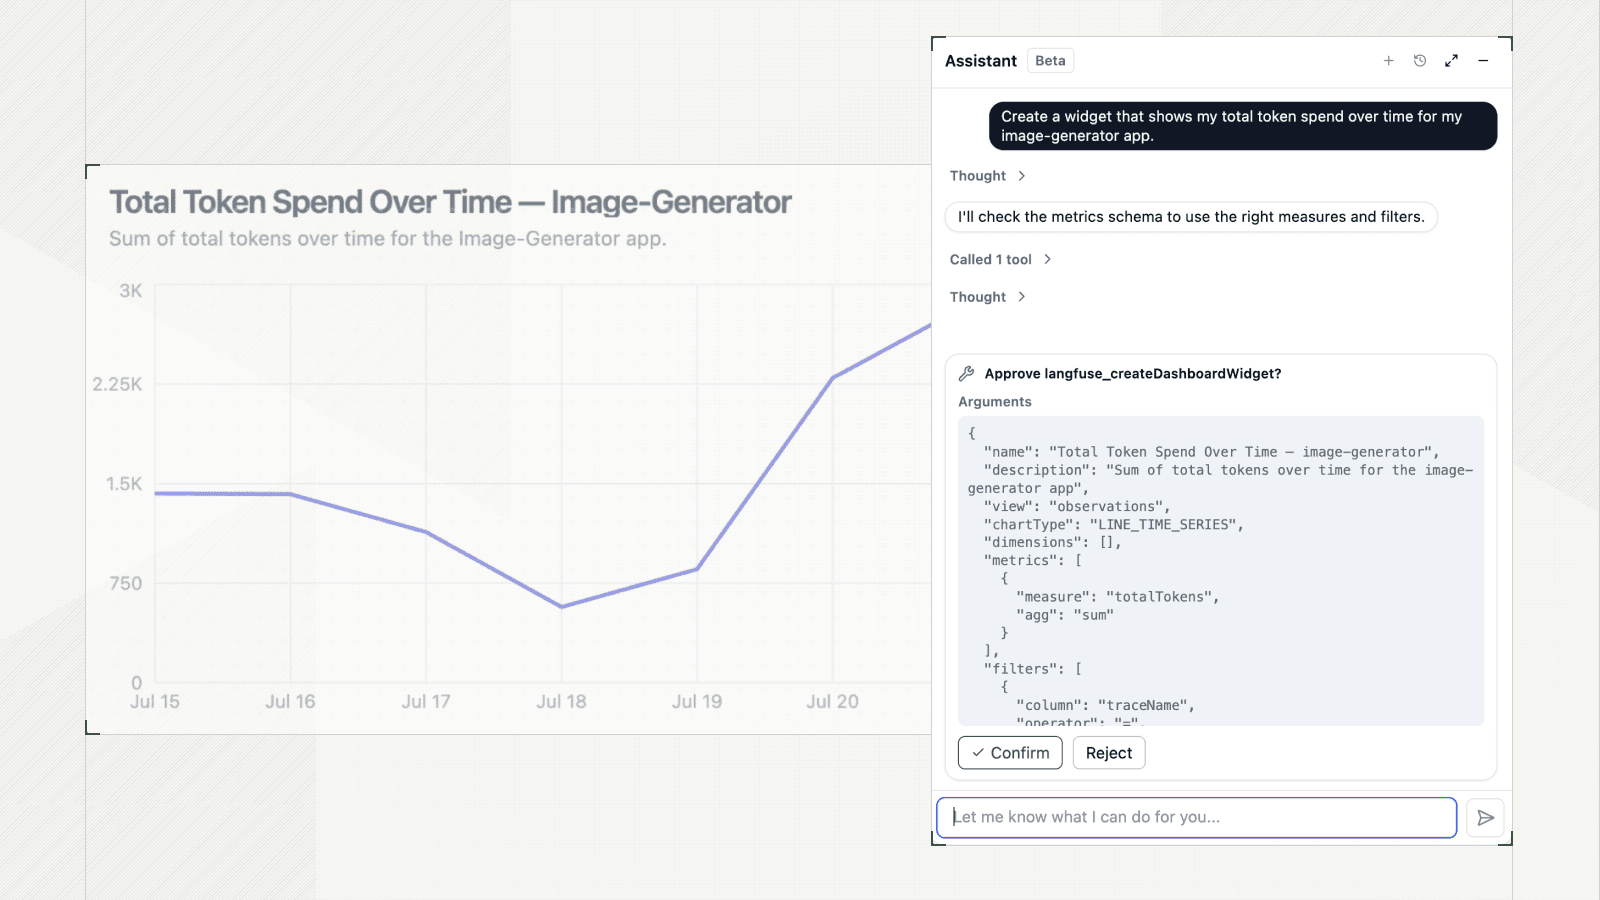
Dashboards and widgets are now in the public API, so you can create and manage them end-to-end in code. The Langfuse CLI picks the new endpoints up automatically, and the Langfuse MCP server exposes the same operations as tools. Keep dashboard definitions in version control and roll one monitoring setup out across every project and environment, or hand the job to a coding agent and ask it to chart error traces for a single feature over time.
The Langfuse Assistant in the app runs on the same operations, so you can ask it to build a dashboard without leaving Langfuse.
Graph view: aggregated and expanded modes
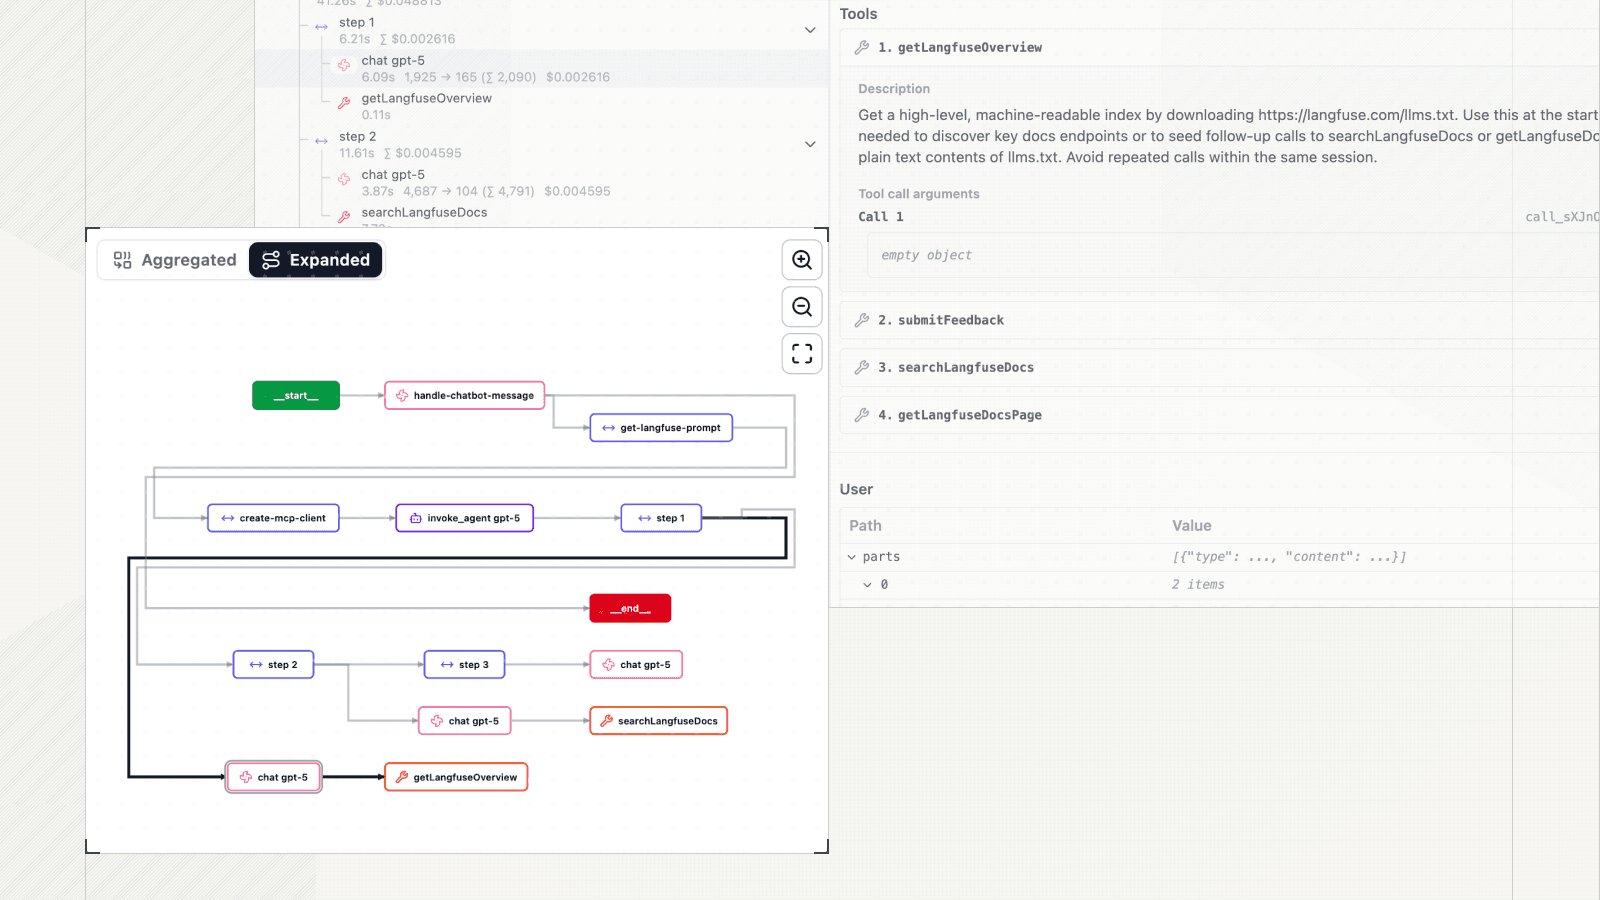
The trace graph view now runs on a rebuilt, deterministic renderer and ships with two modes.
Aggregated collapses steps that share a name into a single node with a counter, so retrieve_docs (3/3) means it ran three times, and loops draw as cycles. It's the fastest way to see an agent's overall shape.
Expanded gives every call its own node and unrolls loops into a DAG in execution order, for walking through one specific run. The layout draws the same way every time you open a trace, and the viewport stays put as you pan and zoom.
Preview media
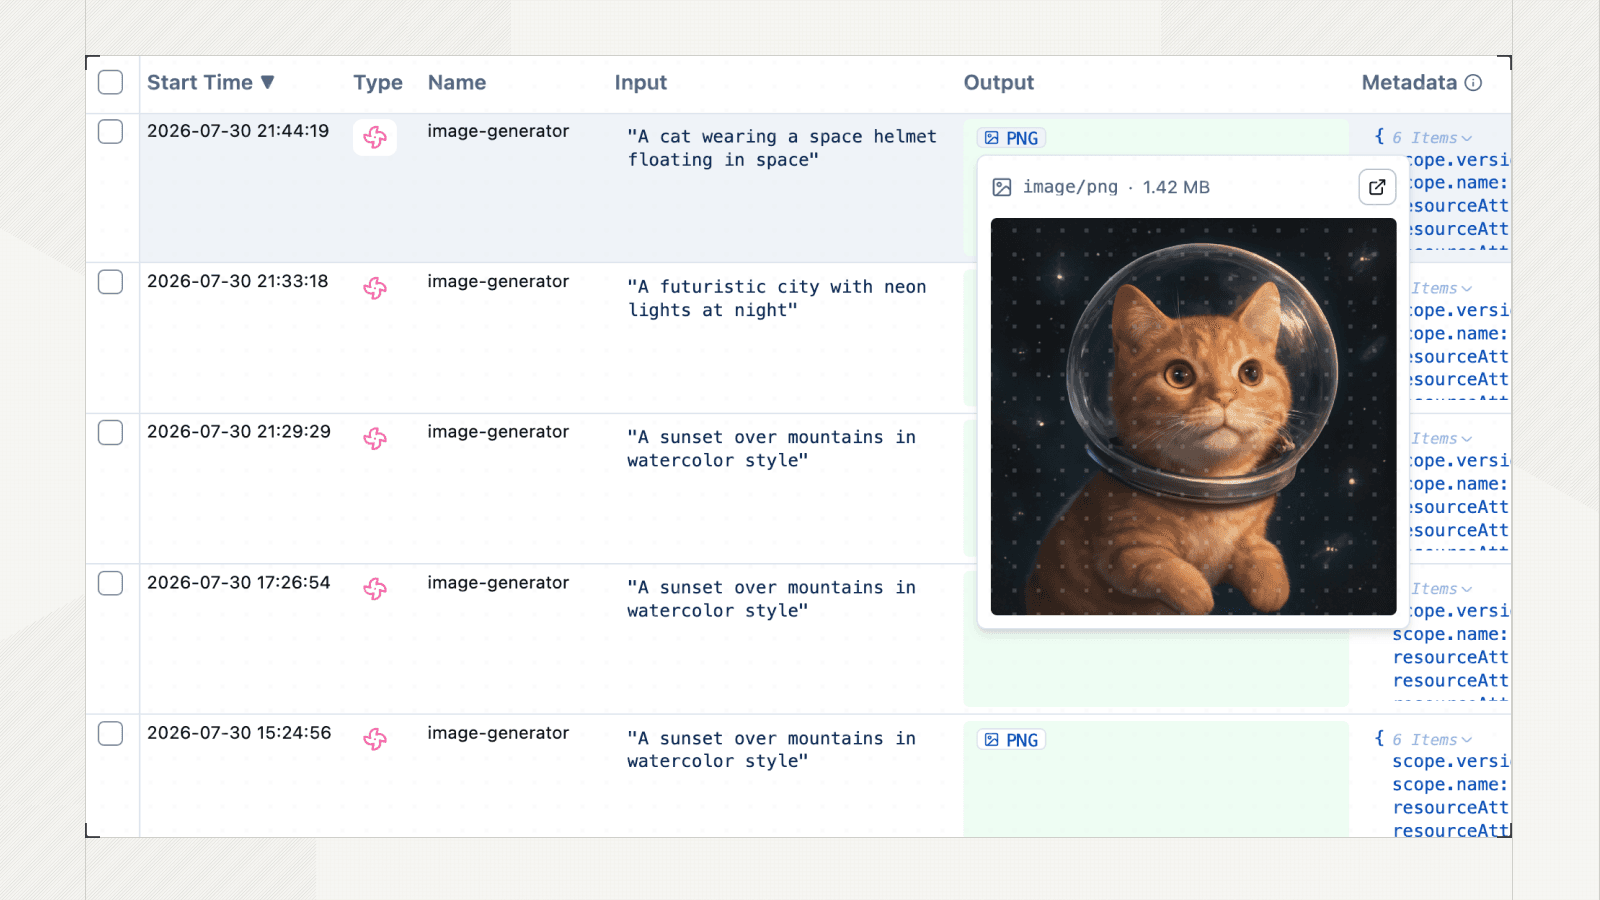
Langfuse now renders previewable media as compact tags in JSON and table views. Langfuse media references, data URIs, and URLs with clear media extensions are detected automatically, so you can open the tag and inspect the image, audio, or file without leaving the trace, observation, or dataset item you're looking at.
Also shipped in July
- Integration: Vercel AI SDK 7 support in
@langfuse/vercel-ai-sdk5.9.0 (changelog) - Home is now a dashboard you can customize, with widgets you can copy or export as portable JSON (changelog)
- Query experiments programmatically with
listExperimentsandlistExperimentItems, in the API and over MCP (changelog) - Parquet exports to blob storage, now the default for new integrations (changelog)
- Evaluate tool calls with a structured
tool_callsfield in code and LLM-as-a-Judge evaluators (changelog) - Filter tables by true or false score values (changelog)
- Chart true rates and alert on boolean scores in dashboards and monitors (changelog)
- Route blob export and evaluator deactivation alerts to Slack or a webhook (changelog)
- The Observations table now opens on root observations and application entry points (changelog)
- Large observation inputs, outputs, and metadata stay inspectable in the UI (changelog)
- Secure remote experiment triggers with an HMAC signature and custom headers (changelog)
- and many more!
Worth reading
- Yes, you can copy our eval setup — Annabell publishes the eval setup for our docs chatbot in full. Custom doesn't mean from scratch.
- Building Deployment Gates for LLMs and AI Agents in Financial Services — Doneyli on using datasets, experiments, and the public API to build automated pass/fail gates.
- Writing good evaluators — new in Langfuse Academy: verifiable checks where you can get them, one binary judge per failure mode, and validating judges against your own labels.
- Datasets — how to build and structure test datasets for evaluating changes to your app.
Upcoming events
- Langfuse Town Hall — Wednesday, August 12, 6 pm CEST
- Langfuse at Open House, ClickHouse's conference, in seven cities:
- AI Demo Night Seattle — Thursday, August 6, 5 pm PDT
- AI Demo Night New York — Tuesday, August 18, 5 pm EDT